Script Debugger 7 Scripts & Clippings Changes

Script Debugger 7 (Build 7A20) introduces a change in how the Scripts menu, Clippings menu, and Clippings pane are populated. We’re looking for feedback.

In previous versions, when Script Debugger was launched it would look inside the user’s ~/Library/Application Support/Script Debugger N/ folder for Clippings and Scripts folders, and populate them with the set of factory scripts if they were not already present.

This posed problems if files had to be updated, because users may have customized the scripts or clippings.

Now, Script Debugger will no longer copy the clippings and scripts into the user’s Application Support folder, and the files will no longer be editable. Instead, the menus and clippings list will be divided into two sections: user scripts/clippings, which will be any the user has added to the relevant ~/Library/Application Support/Script Debugger 7 folder, and application scripts/clippings, which are the ones that ship with Script Debugger.

The two sections will be separated by a divider, and you can use the existing BBEdit-style naming conventions to order items within the user section. The user scripts/clippings will appear at the top, although this can be changed by setting the expert preference PrefUserItemsAboveAppItems to false. If there are no user scripts/clippings, there will be no divider.

Users who have a lot of their own scripts/clippings can also hide the application-provided ones using the expert preference PrefShowAppScriptsAndClippings.

A new script menu item, Import clippings, will allow you to transfer app-provided clippings into the user’s Clippings folder, should you wish to use a modified version.

Important: If you have already run a beta version of Script Debugger 7, the script/clippings will have already been copied to you library, so you will see them listed twice. You can fix this by deleting them from your ~/Library/Application Support/Script Debugger 7 folder (assuming you have not customised them).
2 Likes

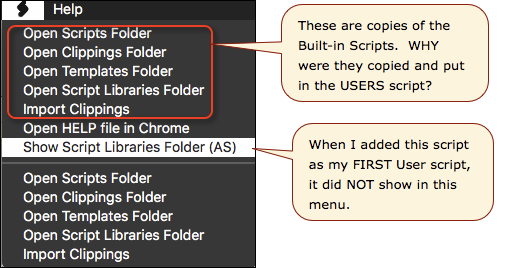
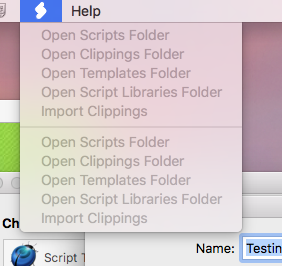
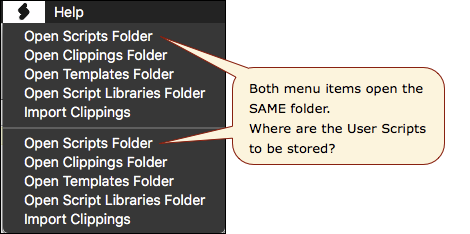
I just installed SD7 7A23 (my first install of SD7), and it is showing both a user and an application section in the menu, even though I don’t have any user scripts (yet).

image

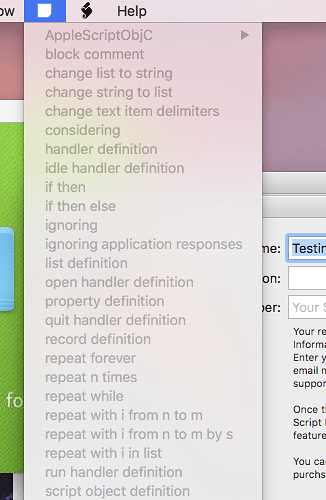
image

So, shouldn’t there just be one block, the application block?
Where are the User Scripts to be stored?

Suggestion: Add a label for each block to clearly identify which is User Scripts and which is Application Scripts

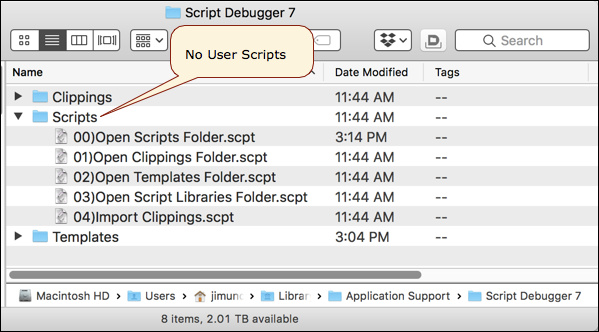
It does NOT seem to be working as descripted.
The App Scripts WERE copied and put into the Users Scripts folder:

image

Also, when I added my first script to the Users Scripts folder (by drag/drop), it did NOT show up in the SD7 Scripts menu.
It did not show up until I did the following:

  1. Add another script
  2. Delete the first script
  3. Copy the first script again back into the folder

Jim, is it possibly you installed an earlier version some time back, and just forgot about it? The reason I ask is that the code that copied the files across has been cut from SD7 completely.

The Open Scripts Folder script should take you there.

OK. The code for updating the menu is unchanged from SD6, except that it’s updating only a section of the menu. Is this folder under the control of DropBox, or aliased? Do you have Spotlight on?

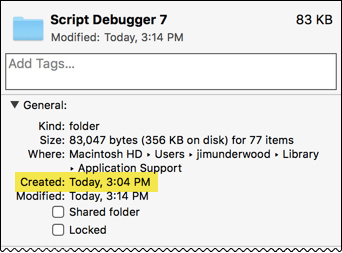
Shane, I’m pretty sure this is my first install of SD7. Here’s the Finder Info about it:

image

No to all of the above, except “Spotlight”. What do you mean by “Spotlight on”?
The only “Spotlight” I know about is the macOS Spotlight search, and yes, that is available.

I think it is confusing for the built-in scripts to have “Open … Folder” without saying they are user folders. Maybe these scripts should either be shown under the User section, OR, change the name to include “User”, as in “Open User Scripts Folder”.

Unfortunately that would look the same either way. If you have something like Time Machine backup it would be interesting to know for sure, but honestly, I can’t see any other explanation. Maybe others will pipe in with their experiences.

(And yes, I meant the OS Spotlight indexing — sorry I wasn’t clearer.)

Another approach to testing this is to attempt a new Script Debugger 7 installation and see what results. Here are the steps:

  1. quit all versions of Script Debugger
  2. delete ~/Library/Preferences/com.latenightsw.ScriptDebugger7.plist
  3. delete ~/Library/Application Support/Script Debugger 7
  4. delete ~/Library/Caches/com.latenightsw.ScriptDebugger7
  5. launch Script Debugger 7

I know I’m a little late to the party, but I just did my first install of SD7, and I got exactly the same result as Jim, two identical versions of the provided scripts and clippings.

I also have the same double set in the menu. I was fixed on testing I hadn’t actually noticed it was an exact double. I had just thought the SD 7 list was a lot longer then the SD6 one.

I’ll try uninstalling (using Mark list of steps) and closely watching the install process to see if I can figure out if there are certain conditions under which the double list occurs.

Bill

I did the five steps Mark laid out and launched SD7. A lot of stuff showed up in the console and and the ScriptDebugger 7 Crash reporter can up. The odd thing is the crash report saying it is for a crash form 2018-01-18 22:28:42.093 -0800, 6 days ago. I’m not sure why a 6 day old crash report came up.

I saved both the “crash report” and “console output” into text files and zipped the file into a archive called “Archive.zip”. I sent the crash report incase there was some information that isn’t captured by copying the contents of the SD crash reporter. I referenced this topic in the crash report.

Bill

'm able to reproduce this as well. I created a new user account, installed and run Script Debugger 7. Like you all, I got duplicate menus:

43%20PM

and

We’ll get this sorted out in a future build.

1 Like

Mark and Shane,

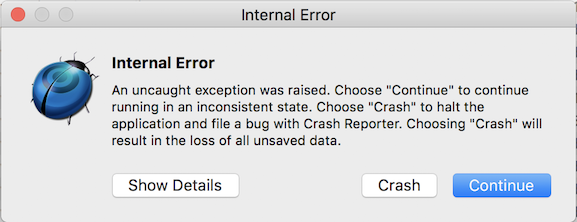
I went into the system folder and removed everything that had anything to do with script debugger. The exact files I removed are listed in the file “Files removed.txt”. Then I logged out of my account and back in again to make sure all the user processes had been shut down and brought back up again. Then I launched SD7 thinking it would do a clean install of SD 7. But SD7 got an Internal Error

Internal%20error%20dialog

I clicked the “Show Details” button and the contents of what was displayed are contained in the “Show details text.txt” text file. Then I clicked the crash button. Apple Crash reporter showed up and the contents of that crash report are in the file “Apple crash report.txt”. When I launched SD7 the SD7 crash report came up and the contents of the crash report are in the file “Script Debugger crash report.txt”

I was able to create a new window, go to clippings menu and and insert a clipping with any problems or errors. But the items in the Clipping menu were still duplicated like they were before. This seems to suggest that when no files or folders are already loaded into the user library for SD7 it get an internal error and the items in the clipping menu are are duplicated. When there are clippings in the library folder the menu items are just duplicated. Of course someone buying SD7 without ever using ScriptDebugger before that would get the internal error.

I was not expecting an internal error. I thought removing all the ScriptDebugger stuff from the folders “Application Support” “Caches” and “Preferences” in the user Library folder would do a new clean install.

I used a program called “Find Any File” to search the entire user library folder for anything named
“latenightsw,” “ScriptDebugger” or “Script Debugger.” No files were found.

All the files that go with this report are stored in a zip archive called “The files.zip” which has been included in this post. The files included are:

  • Files removed.txt
  • Script Debugger crash report.txt
  • Apple crash report.txt
  • Show details text.txt
  • Internal error dialog.png

I’m not sure what to make of this result, nor am I sure what to try next. It seems like there are more issues then I first expected.

Bill

The files.zip (170.4 KB)

Hey Mark

I’m sorry for bumping this old thread.

Speaking of the expert Preference you mentioned I wasn’t able to find it documented anywhere.

I’m remembering the use of it do to my own Clippings Structure a long time ago and I thought I had documented it for myself - but I was wrong.

I have a huge structure where I integrated the default ones into and also have them changed to my liking.

It would be very kind of you if you could provide me the information on how to use it outside Script Debugger with the Terminal and from within Script Debugger via ASObjC

  • Getting the current used value if it’s used

  • Setting it to hide the Clippings / Clippings and Scripts

Many thanks :pray: in advance

Greetings from Germany :de:

Tobias

From Terminal:

defaults write com.latenightsw.ScriptDebugger7 PrefShowAppScriptsAndClippings -bool YES

From a script window:

use AppleScript version "2.4" -- Yosemite (10.10) or later
use framework "Foundation"

current application's NSUserDefaults's standardUserDefaults()'s setObject:true forKey:"PrefShowAppScriptsAndClippings"
1 Like

Many thanks Shane, appreciate this …

I know how to get a Plist Key‘s value using the defaults read command …

Is there any equivalent to do it in ASObjC (not speaking of shell commands used with NSTask…) ?

Greetings from Germany :de:

Tobias

That’s what the second example does.

1 Like

Sorry to say that - but that’s not true …

setObject:forKey: is writing the Value - not reading it …

You’ve only provided the equivalent to defaults write …

Greetings from Germany :de:

Tobias

I misunderstood your question.

use AppleScript version "2.4" -- Yosemite (10.10) or later
use framework "Foundation"

current application's NSUserDefaults's standardUserDefaults()'s boolForKey:"PrefShowAppScriptsAndClippings"

2 Likes

Thanks again, Shane

Appreciate your help …

Greetings from Germany :de:

Tobias