If anybody is interested in the full process I used, I set out the full example below, with some annotations. Of course, it requires some error trapping and further development.
use AppleScript version "2.4" -- Yosemite (10.10) or later
use scripting additions
use framework "Foundation"
use framework "AppKit"
use script "Myriad Tables Lib" version "1.0.9"
--property theCheckbox : missing value
property thePopup : missing value
property theAccessoryView : missing value
--Some examples of Fixed Income ETF tickers for reference:
set theURL to "https://uk.finance.yahoo.com/quote/GOVT/history?p=GOVT" --US Govt Bonds
set theURL to "https://uk.finance.yahoo.com/quote/IAF.X/history?p=IAF.X" --AUD Govt Bonds
set theURL to "https://uk.finance.yahoo.com/quote/XGB.TO/history?p=XGB.TO" --CAD Govt Bonds
set theURL to "https://uk.finance.yahoo.com/quote/UKCO.L/history?p=UKCO.L" --GBP Corporate Bonds
set theURL to "https://uk.finance.yahoo.com/quote/GLTS.L/history?p=GLTS.L" --GBP Gilts 1-5 years
set theURL to "https://uk.finance.yahoo.com/quote/IGLT.L/history?p=IGLT.L" --GBP Gilts 15+ years
set theURL to "https://uk.finance.yahoo.com/quote/GLTY.L/history?p=GLTY.L" --GBP Gilts all maturities
--===============================
--::To get the data
set theText to ""
--repeat with currentURL in theURL
set theData to do shell script "/usr/bin/curl " & theURL & " | /usr/bin/textutil -stdin -convert txt -stdout" -- get URL & strip formatting
--return theData
set theContents to paragraphs of theData as list
set theLength to length of theContents
--cleanup procedure on junk data
set startItems_to_discard to 50 --there are 50 junk values to be discarded from the start--this could change
set endItems_to_discard to 27 --there are 27 junk values to be discarded from the end --this could also change
set theDataLength to (theLength - endItems_to_discard)
set theContentsBody to items startItems_to_discard thru theDataLength of theContents --!!!!!!!!!! This could change
--return theContentsBody
--the headers may change: here are two observed cases so far:
set thedataHeaders to items 1 thru 9 of theContentsBody
if item 1 of thedataHeaders is in {"Currency in GBP"} then
set theHeaders to items 3 thru 9 of thedataHeaders
set theHeaderPoint to 10
else
set theHeaders to items 1 thru 6 of thedataHeaders
set theHeaderPoint to 7
end if
set theHeadersLength to length of theHeaders
--return {theHeaders, theContentsBody}
set theContentsBodyLength to the count of theContentsBody --about 733 items
--this tries to keep the headers and body data in sync depending on which headers have been received
set theContentsBodyData to items theHeaderPoint thru theContentsBodyLength of theContentsBody
--return {theHeaders, theContentsBodyData}
--prepare to create a list of lists by variable types
set theDates to {}
set theHighs to {}
set theLows to {}
set theDailyRange to {}
set theClosingPrice to {}
set theClosingPriceChange to {}
set theVolume to {}
repeat with i from 1 to the count of theContentsBodyData by (count of theHeaders) --6
log "aDateString" & item i of theContentsBodyData
try
set aDateString to item i of theContentsBodyData
set aDateObject to date aDateString
set the end of theDates to aDateObject
set aHigh to item (i + 2) of theContentsBodyData
set aLow to item (i + 3) of theContentsBodyData
set aRange to (aHigh * 1 - aLow * 1)
set the end of theDailyRange to aRange
set aClose to item (i + 5) of theContentsBodyData
log "aClose is: " & item (i + 5) of theContentsBodyData
set the end of theClosingPrice to (aClose * 1)
set aVolume to ((item (i + 6) of theContentsBodyData) * 1) as integer
set the end of theVolume to aVolume
end try
end repeat
--yahoo presents the data in descending chronological order, we need to reverse this
set orderedDates to the reverse of theDates
set orderedRanges to the reverse of theDailyRange
set orderedCloses to the reverse of theClosingPrice
set orderedVolumes to the reverse of theVolume
set orderedPriceChanges to {}
--calculate price percentage change:
set orderedPricePercentageChanges to {}
repeat with i from 1 to the count of orderedCloses
if i = 1 then
set thePrevClose to item 1 of orderedCloses
set thePriceChange to 0
set thePricePercentageChge to 0
else
set thePrevClose to item (i - 1) of orderedCloses
set theClose to item i of orderedCloses
set thePricePercentageChge to (((theClose / thePrevClose) - 1) * 100)
set thePriceChange to (theClose - thePrevClose) * 100
end if
set the end of orderedPriceChanges to thePriceChange
set the end of orderedPricePercentageChanges to thePricePercentageChge
end repeat
--shift the values up one row to correctly align them
set percentageChangeListLength to length of my orderedPricePercentageChanges
set adjusted_orderedPricePercentageChanges to items 2 thru percentageChangeListLength of orderedPricePercentageChanges
set the beginning of adjusted_orderedPricePercentageChanges to 0
set orderedPricePercentageChanges to adjusted_orderedPricePercentageChanges
--return {orderedPricePercentageChanges, adjusted_orderedPricePercentageChanges}
--calculate volume percentage change:
set theVolumeChange to {}
set theVolumePercentageChange to {}
repeat with i from 1 to the count of orderedVolumes
if i = 1 then
set thePrevVolume to item 1 of orderedVolumes
set theVolumeChge to 0
set theVolPctChange to 0
else
set thePrevVolume to item (i - 1) of orderedVolumes
set theVolume to item i of orderedVolumes
set theVolume to theVolume * 1
set theVolumeChge to (theVolume - thePrevVolume) * 1
set theVolPctChange to ((theVolumeChge / 100) / thePrevVolume) * 100
end if
set the end of theVolumeChange to theVolumeChge
set the end of theVolumePercentageChange to theVolPctChange
--set the end of theVolumePercentageChange to {}
end repeat
--adjust variable naming to generic handlers:
set cleaned_LoL to {orderedDates, orderedCloses, orderedPriceChanges, orderedPricePercentageChanges, orderedRanges, orderedVolumes, theVolumeChange, theVolumePercentageChange}
set column_headings to theHeaders
--hard coding the headers for now:
set column_headings to {"Date", "Px Close", "Px Chge (bps)", "Px Chge (%)", "Hi-Lo Range", "Volume", "Volume Chge", "Volume Chge (%)"}
--merge the lists to create a table of rows, the two variables below, if true, add tab delimiters and carriage returns
set carriageReturn to false
set dataTab to false
--generate the Myriad table, with popup accessory, with the data:
set table_data to my toGenerateTable(cleaned_LoL, carriageReturn, dataTab) --merges lists into a set of row lists for table display
set theTable to my make_dataTable_withAccessory(table_data, column_headings)
set theAction to item 1 of theTable
---process the result of any popup selection: note that only Keynote Chart and Keynot Table are created
if theAction is "Select an action" then --no action was chosen
return {column_headings, table_data}
--Keynote Charts created using applescript do not like decimal points with small numbers, so a table is created to faciliate copy and paste into chart editor.
else if theAction is "Export to Keynote Chart" then
set keynote_Table_dataLoL to a reference to cleaned_LoL
set theDatesData to item 1 of keynote_Table_dataLoL
--in other api types that include UTF time, time would be item 2
--set theColumnData to items 3 thru length of keynote_Table_dataLoL --item 2 is time, dont need it in this version
--this api does not give us time, so we dont skip item 2 of table data:
set theColumnData to items 2 thru length of keynote_Table_dataLoL
--set xAxisRowData to theDatesData:
set xAxisRowData to item 1 of my convert_cleanedLoL_datesToString(cleaned_LoL) --only wants date strings
-->{"10/02/2023", "13/02/2023", "14/02/2023", "15/02/2023", "16/02/2023"}
set bodyData_as_listOfLists to theColumnData
--return bodyData_as_listOfLists
set chartData to my toGenerateTable(bodyData_as_listOfLists, carriageReturn, dataTab)
set columnHeaders to column_headings
set columnHeaders to text items 3 thru length of columnHeaders --remove Date and Time headers
---to first place a table in the slide for updating chart values to show decimals, when working with rates
set data_for_KeynoteTable to a reference to cleaned_LoL
set data_for_KeynoteTable to my convert_cleanedLoL_datesToString(cleaned_LoL) --creates LoL for body data only, the dates and column are in separate single lists
set keynote_tableData to my toGenerateTable(data_for_KeynoteTable, false, false) --creates table array
---to place a chart in the slide for updating values to show decimals using table created:
set createChart to my generateKeynoteLineChart(xAxisRowData, columnHeaders, chartData, keynote_tableData) --groupByColumns : the table is created first and this is fine
else if theAction is "Export to Keynote Table" then
set data_for_KeynoteTable to a reference to cleaned_LoL
set data_for_KeynoteTable to my convert_cleanedLoL_datesToString(cleaned_LoL)
set keynote_tableData to my toGenerateTable(data_for_KeynoteTable, false, false) --creates table array
--the handler below creates and populates a Keynote table, cell by cell, it is much, much, faster with large data sets to pass the data formatted as csv text to the clipboard and then paste, but this is an example
set keynote_table to my generateKeynoteTable(keynote_tableData) --works
else
--other actions not created yet
return
end if
---Keynote Handlers------
on convert_cleanedLoL_datesToString(cleaned_LoL)
set theDatesColumn to item 1 of cleaned_LoL
set the_bodyData to items 2 thru length of cleaned_LoL
set theDateStringColumn to {}
repeat with i from 1 to count of theDatesColumn
set anItem to item i of theDatesColumn
try
set aDateString to short date string of anItem
set the end of theDateStringColumn to aDateString
on error
set aDateString to anItem
set the end of theDateStringColumn to aDateString
end try
end repeat
set the beginning of the_bodyData to theDateStringColumn
return the_bodyData
end convert_cleanedLoL_datesToString
on generateKeynoteTable(data_for_KeynoteTable) --groupByColumns
--row height for data should be 32 pt
--row width for data should be 127 pt
set tablePosition to {1077, 178} -- this is 1/3rd from right hand edge
set tablePosition to {50, 50} -- this is 1/3rd from right hand edge
set columnCount to length of item 1 of data_for_KeynoteTable
set rowCount to length of data_for_KeynoteTable
tell application "Keynote"
activate
set thisDocument to front document
tell thisDocument
-- MAKE NEW SLIDE
set thisSlide to make new slide with properties {base layout:slide layout "Blank"} --"Title - Top"} --"Title - Top" / "Title, Bullets & Photo" /"Title, Bullets & Photo"/"Photo - Vertical"
-- set thisSlide to the first slide
tell thisSlide
--set the object text of the default title item to "Grouped by Column"
set thisTable to ¬
make new table with properties ¬
{column count:columnCount, row count:rowCount, footer row count:1, header column count:1, header row count:0, position:tablePosition}
set rowIndex to 0
set columnIndex to 0
tell thisTable
set the rowCellCount to count of cells of row 2
repeat with i from 1 to count of the data_for_KeynoteTable
set thisRowData to item i of the data_for_KeynoteTable
tell row (rowIndex + i)
repeat with q from 1 to count of thisRowData
tell cell (columnIndex + q)
set value to item q of thisRowData
end tell --cell
end repeat
end tell --row
end repeat
end tell --table
--set slideProperties to get its properties
end tell --slide
end tell --document
end tell
end generateKeynoteTable
on generateKeynoteLineChart(xAxisRowData, columnHeaders, chartData, data_for_KeynoteTable) --groupByColumns
set tablePosition to {1077, 178} -- this is 1/3rd from right hand edge
set columnCount to length of item 1 of data_for_KeynoteTable
set rowCount to length of data_for_KeynoteTable
tell application "Keynote"
activate
-- MAKE NEW DOCUMENT
--the chart default position is x:y, 300:388, and size is W:H 1483:538 ppoints--the widescreen format is height 1080 width 1920
--set thisDocument to make new document with properties ¬
{height:1080, width:1920} --Black would also work--"LatAm Avenir Automator v 2"
--OR USE AN OPEN DOCUMENT
set thisDocument to front document
tell thisDocument
-- MAKE NEW SLIDE
set thisSlide to make new slide with properties {base layout:slide layout "Blank"} --"Title - Top"} --"Title - Top" / "Title, Bullets & Photo" /"Title, Bullets & Photo"/"Photo - Vertical"
tell thisSlide
--Here you would create a Slide Title
-- set the object text of the default title item to "Grouped by Column"
--MAKE A NEW TABLE
set thisTable to ¬
make new table with properties ¬
{column count:columnCount, row count:rowCount, footer row count:1, header column count:1, header row count:0, position:tablePosition}
set rowIndex to 0
set columnIndex to 0
tell thisTable
set the rowCellCount to count of cells of row 2
repeat with i from 1 to count of the data_for_KeynoteTable
set thisRowData to item i of the data_for_KeynoteTable
tell row (rowIndex + i)
repeat with q from 1 to count of thisRowData
tell cell (columnIndex + q)
set theItemValue to item q of thisRowData
--Remove zeros and replace with "" for chart, otherwise chart will have spikes
if theItemValue = 0 then
set theItemValue to ""
end if
-- set value to item q of thisRowData
set value to theItemValue
end tell --cell
end repeat
end tell --row
end repeat
end tell --table
-- MAKE A CHART FROM DATA (GROUPED BY ROW)
set thisChart to add chart row names xAxisRowData ¬
column names columnHeaders ¬
data chartData ¬
type line_2d ¬
group by chart column
--other aspects will need GUI Scripting --see SD Forum or macscripter
tell chart 1
set its height to 857
set its width to 763
set its position to {184, 148}
end tell
--set slideProperties to get its properties
end tell
end tell
end tell
end generateKeynoteLineChart
## HANDLERS FOR RECOMBINING RECORDS AND LISTS AFTER PROCESSING ENTERPRAI DATA SET ##
-------LOOPING HANDLERS: ## PPD 1 - ## PPD 2 ------- ###
## PPD 2- post process data
on toGenerateTable(listOfLists, carriageReturn, dataTab) --{list1, list2, list3}
set theTable to {} --set an output list
set theListCount to count of items of listOfLists --count the number of columns for populating one row
set theItemsCount to count of items of item 1 of listOfLists --count the number of rows we need to process
repeat with i from 1 to theItemsCount --Outer Loop
set theRowNumber to i
set theRow to my populateOneRowWithColumns(theRowNumber, listOfLists, dataTab) --Inner Loop
if carriageReturn is false then
set the end of theTable to theRow
else
set the end of theTable to theRow & return
end if
end repeat
return theTable
end toGenerateTable
## PPD 1- post process data
on populateOneRowWithColumns(theRowNumber, listOfLists, dataTab) --processs values for toGenerateTable
set theRowData to {}
set theListCount to count of items of listOfLists --3
set n to theRowNumber
if dataTab is true then
repeat with i from 1 to theListCount
set the end of theRowData to (item n of item i of listOfLists) & tab
end repeat
return theRowData
else
repeat with i from 1 to theListCount
try
set theItem to (item n of item i of listOfLists)
set the end of theRowData to theItem
on error
display dialog "Handler: toGenerateTable:populateOneRowWithColumns: Error populating table row with columns; i is:" & i
end try
end repeat
return theRowData
end if
end populateOneRowWithColumns
## ------- END OF HANDLERS FOR RECOMBINING LISTS AFTER PROCESSING Yahoo DATA SET ------
--------TABLE CREATION HANDLERS----------
---advanced table with accessory: ASOBJC
on make_dataTable_withAccessory(table_data, column_headings)
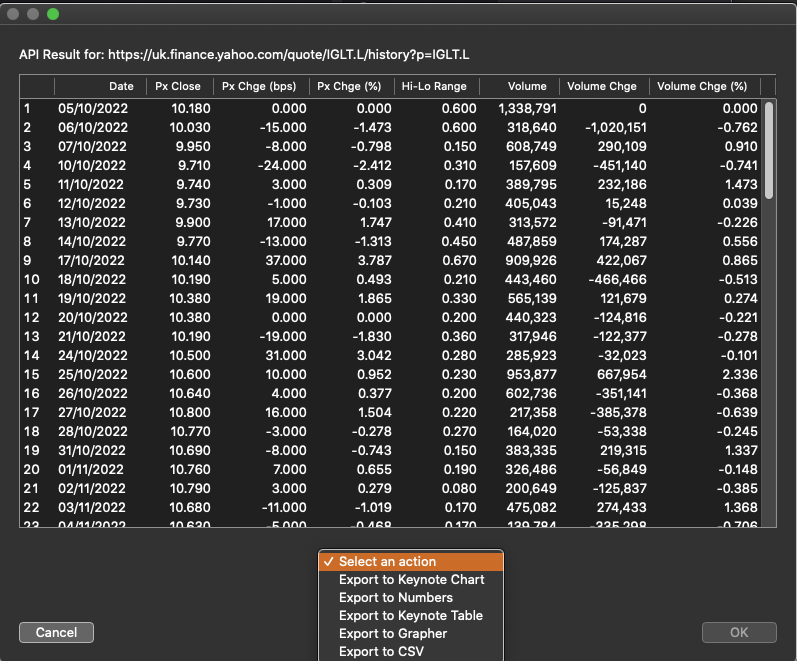
set popupList to {"Select an action", "Export to Keynote Chart", "Export to Numbers", "Export to Keynote Table", "Export to Grapher", "Export to CSV"}
-- Manipulation of views should be done on the main thread
if current application's NSThread's isMainThread() as boolean then
--my createCheckBoxMainThread:{"Check me", "checkboxClicked:"}
my createPopupMainThread:{popupList, "Select an action"}
my buildAccessoryViewMainThread:{theCheckbox, thePopup}
my buildAccessoryViewMainThread:{thePopup}
else
--my performSelectorOnMainThread:"createCheckBoxMainThread:" withObject:{"Check me", "checkboxClicked:"} waitUntilDone:true
my performSelectorOnMainThread:"createPopupMainThread:" withObject:{popupList, "Select an action"} waitUntilDone:true
-- my performSelectorOnMainThread:"buildAccessoryViewMainThread:" withObject:{theCheckbox, thePopup} waitUntilDone:true
my performSelectorOnMainThread:"buildAccessoryViewMainThread:" withObject:{thePopup} waitUntilDone:true
end if
-- make a table and add the accessory view
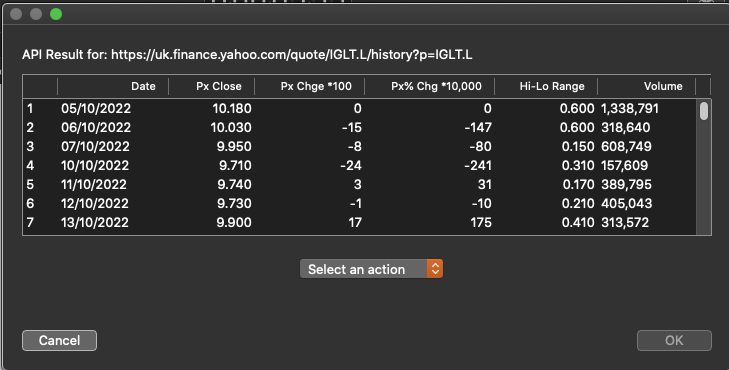
--{"Date", "Px Close", "Px Chge *100", "Px% Chg *10,000", "Hi-Lo Range", "Volume"}
--{"Date", "Px Close", "Px Chge (bps)", "Px Chge (%)", "Hi-Lo Range", "Volume", "Volume Chge", "Volume Chge (%)"}
set row_template to {date, real, real, real, real, integer, integer, real}
--set theTable to make new table with data {"One", "Two", "Three", "Four", "Five"}
set theTable to make new table with data table_data column headings column_headings row template row_template with prompt "API Result for: https://uk.finance.yahoo.com/quote/IGLT.L/history?p=IGLT.L" with row numbering
modify columns in table theTable head alignment align right real format "#,##0.000;-#,##0.000"
--modify table theTable column dragging
modify table theTable column widths pattern {1, 1, 1, 1, 1, 1} --sets width of columns to that of column 1
modify table theTable accessory view theAccessoryView
set theAccessoryView to missing value -- to avoid error messages when saving
display table theTable
-- get the state of the checkbox
--set theState to theCheckbox's state() as boolean
--set theCheckbox to missing value -- to avoid error messages when saving
set theAction to thePopup's title() as text
set thePopup to missing value
--display dialog theValue
return {theAction, column_headings, table_data}
end make_dataTable_withAccessory
(* Dont need check box:
on createCheckBoxMainThread:theArg
set {theTitle, theAction} to theArg as list
-- build a checkbox
set my theCheckbox to current application's NSButton's alloc()'s initWithFrame:{{10, 10}, {150, 18}}
tell theCheckbox
its setButtonType:(current application's NSSwitchButton)
its setTitle:theTitle
its setTarget:me
its setAction:theAction -- a handler in this script
end tell
end createCheckBoxMainThread:
*)
on createPopupMainThread:theArg
set {entryList, defaultValue} to theArg as list
set my thePopup to current application's NSPopUpButton's alloc()'s initWithFrame:{{10, 35}, {150, 26}} pullsDown:false
thePopup's addItemsWithTitles:entryList
thePopup's selectItemWithTitle:defaultValue
end createPopupMainThread:
on buildAccessoryViewMainThread:theControls
set my theAccessoryView to current application's NSView's alloc()'s initWithFrame:{{0, 0}, {160, 60}}
repeat with aControl in theControls
(theAccessoryView's addSubview:aControl)
end repeat
end buildAccessoryViewMainThread:
(*
-- this is called when the checkbox is clicked
on checkboxClicked:sender
-- make an alert and show it as a sheet over the table window
set theWindow to sender's |window|()
set theAlert to current application's NSAlert's alloc()'s init()
theAlert's setMessageText:"You clicked the checkbox"
theAlert's setInformativeText:"Now close this sheet"
theAlert's beginSheetModalForWindow:theWindow completionHandler:(missing value)
end checkboxClicked:
*)